Age and Sex Distribution in Ilocos Sur (2020 Census of Population and Housing)
Issue No.:
2023-006
Release Date:
Friday, March 17, 2023
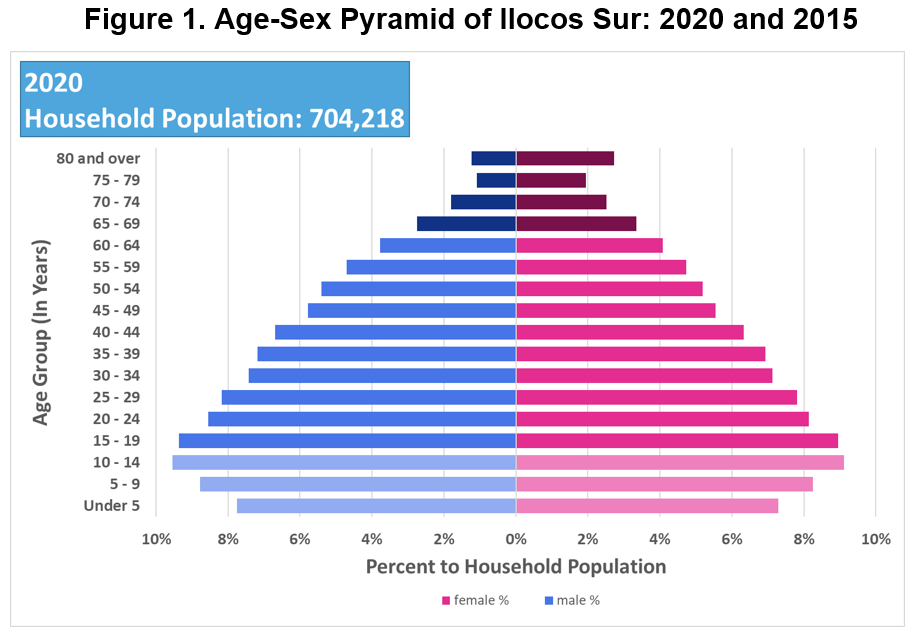
The province of Ilocos Sur is classified as a first-class province in Region 1 with 2 congressional districts, 2 component cities, 32 municipalities, and 768 barangays. According to the 2020 Census of Population and Housing (2020 CPH), it has a total population of 706,009 persons. Of this total, the household population comprised 99.75 percent or 704,218 persons.
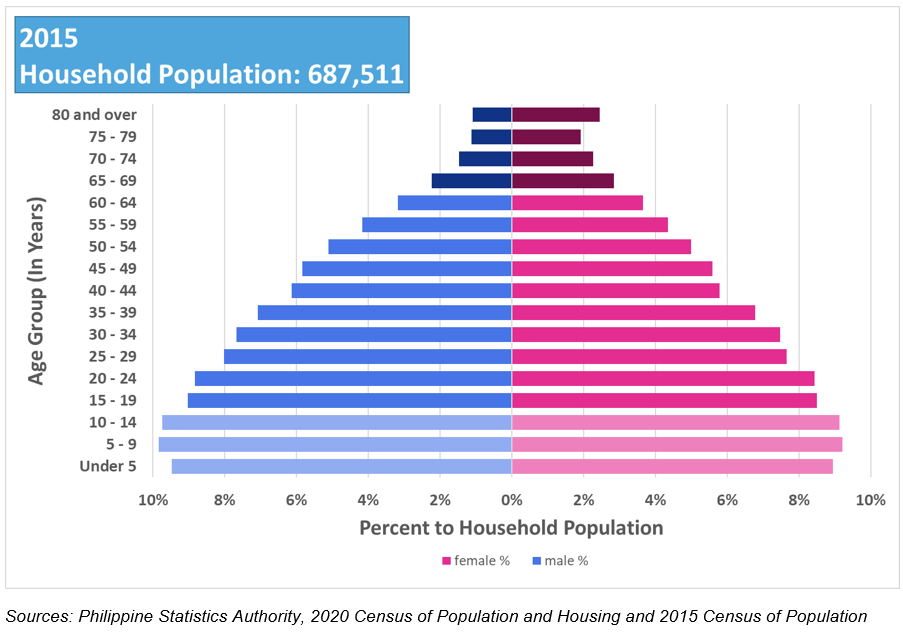
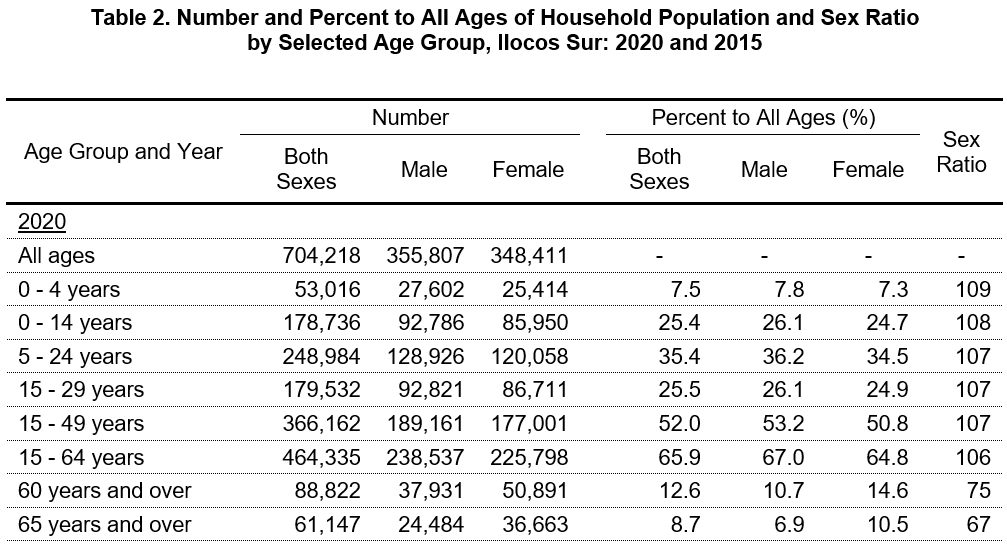
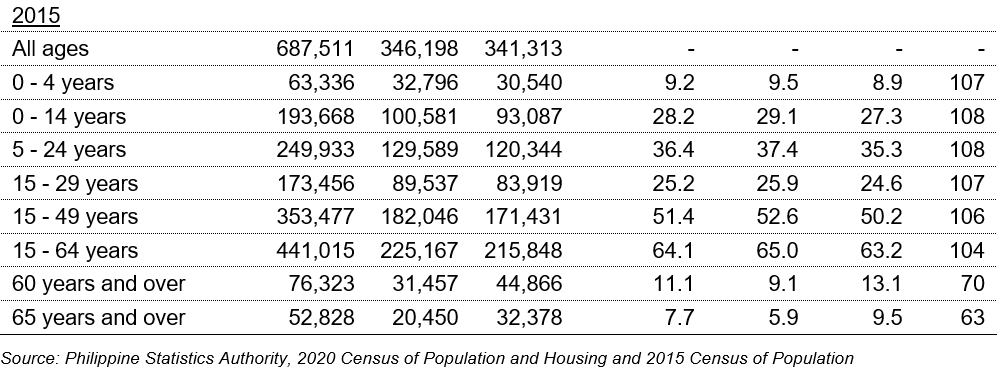
Of these, 355,807 persons (50.5%) were males while 348,411 persons (49.5%) were females. By age group, 178,736 persons (25.4%) were under 15 years of age (young dependents). On the other hand, persons aged 15 to 64 years (working-age or economically-active population) totaled 464,335 persons (65.9%) while those in age groups 65 years and over (old dependents) comprised the remaining 61,147 (8.7%). In 2015, persons aged 0 to 14 years, 15 to 64 years, and 65 years and over accounted for 28.2, 64.1, and 7.7 percent, respectively, of the household population.
Moreover, there were more males (84.6%) than females (80.7%) among the 0 to 54 age group. Meanwhile, among the older age group (55 years and over), females (19.3%) outnumbered males (15.4%). The same trend was also observed in 2015.
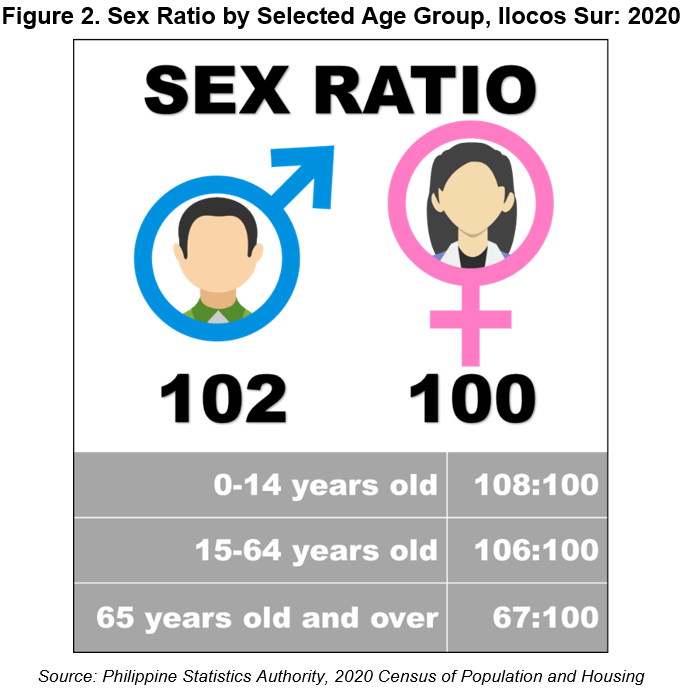
Sex ratio stands at 102 males per 100 females
The sex ratio in the province of Ilocos Sur was computed at 102 in 2020. This means that there were 102 males for every 100 females. The sex ratio in 2015 was slightly lower at 101 males per 100 females. (Figure 2)
In 2020, children aged below 15 years had a sex ratio of 108 males per 100 females, while those aged 15 to 64 years had a sex ratio of 106 males per 100 females. Moreover, among those aged 65 years and over, the sex ratio was 67 males per 100 females. This depicts a longer life expectancy among females than males or a higher mortality rate among males than females in the older age groups. (Figure 2)
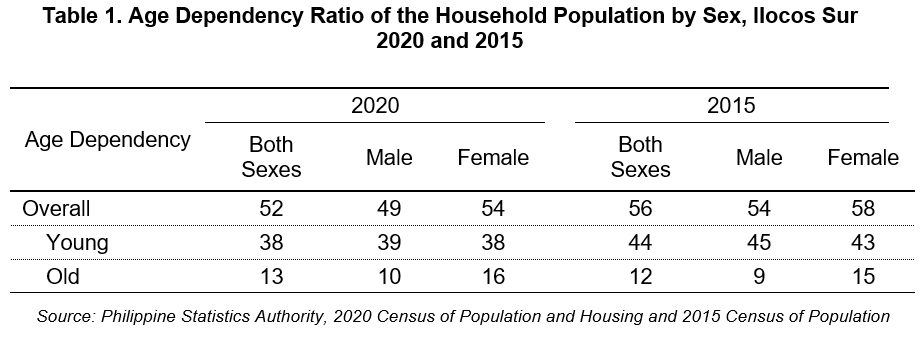
Dependency ratio declines to 52 dependents per 100 persons in the working-age group
The overall dependency ratio of the province of Ilocos Sur was computed at 52, which indicates that for every 100 working-age or economically-active population, there were about 52 dependents (38 young dependents and 13 old dependents). This is lower than the dependency ratio in 2015, which was recorded at 56 dependents per 100 working-age population (44 young dependents and 12 old dependents). (Table 1)
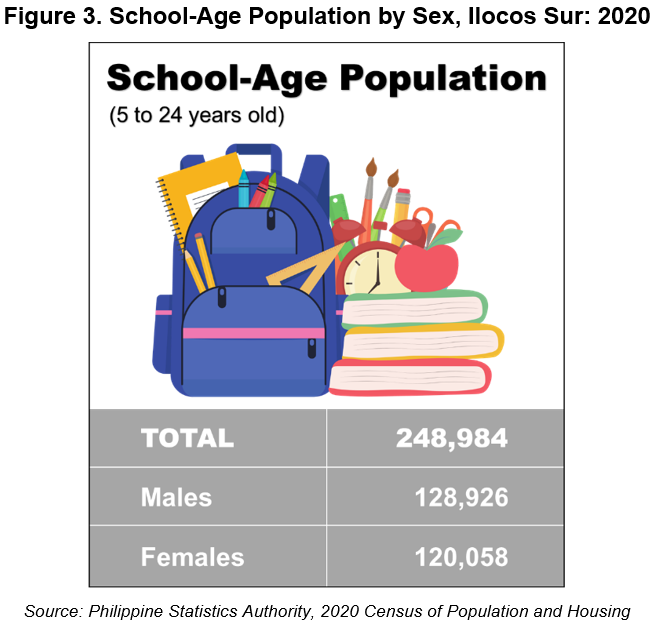
Nearly four in every eleven household population are of school age
In 2020, the school-age population (5 to 24 years old) accounted for 248,984 (35.4%) of the 704,218 household population compared to the 249,933 (36.4%) school-age population that was reported in 2015. (Table 2 and Figure 3)
There are more males than females in children under five years old
Children below five years old comprised 7.5 percent (53,016) of the household population which is slightly lower than the 9.2 percent (63,336) posted in 2015. The sex ratio went up to 109 males per 100 females in 2020 from 107 males per 100 females five years ago.
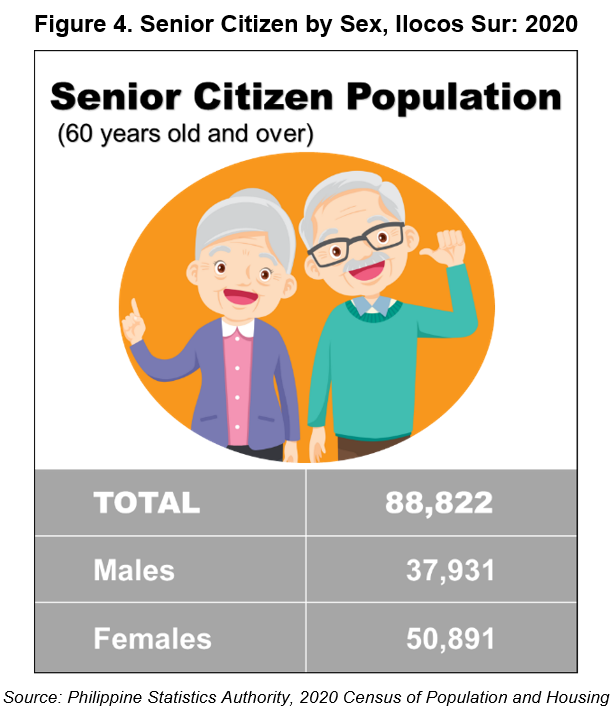
Senior citizens constitute 12.6 percent of the household population
In the Philippines, people aged 60 years old and over are regarded as senior citizens. In Ilocos Sur, they made up 12.6 percent (88,822) of the household population in 2020, higher than the 11.1 percent (76,323) recorded in 2015. There were more females (57.3%) than males (42.7%) among the senior citizens, in 2020. The same trend was observed in 2015. (Table 2 and Figure 5)
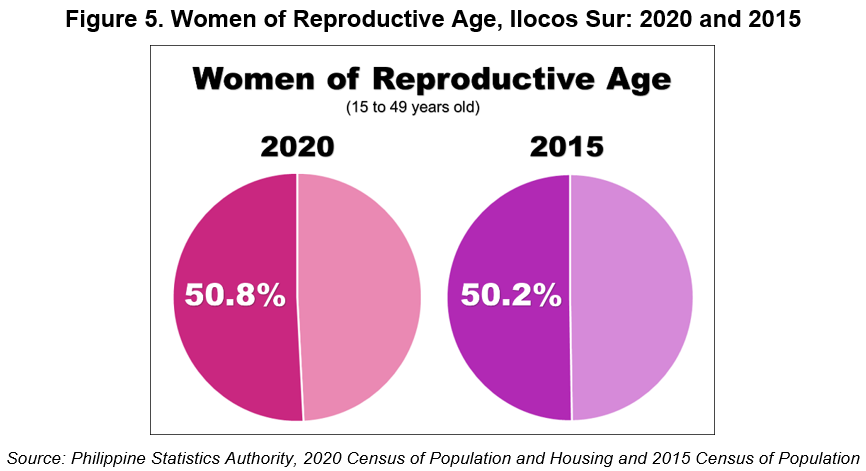
More than half of the female population are of reproductive age
Women of reproductive age (15 to 49 years old) totaled to 177,001 or 50.8 percent of the 348,411 female household population in 2020. These figures were higher compared with the 50.2 percent (171,431) posted in 2015. (Table 2 and Figure 6)
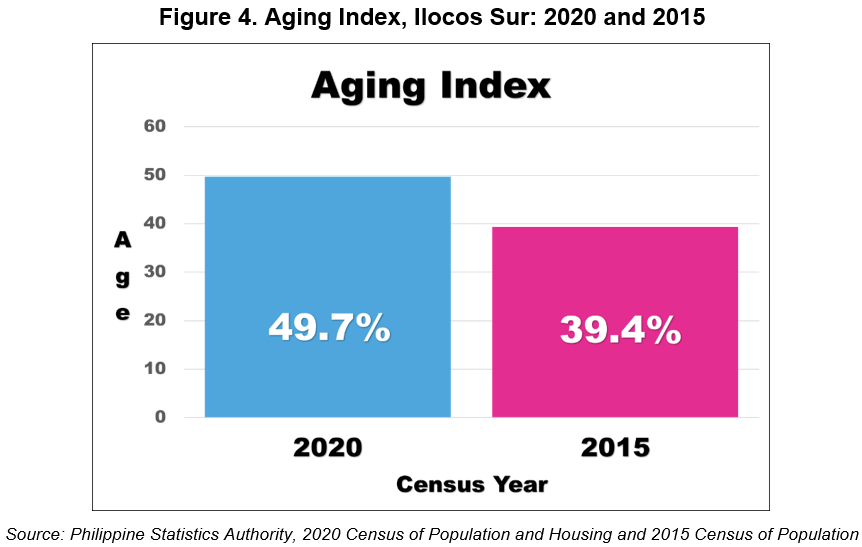
Aging index increases by 10.3 points from 39.4 in 2015 to 49.7 in 2020
In the province of Ilocos Sur, the aging index or the proportion of persons aged 60 years and over per 100 persons under the age of 15 years was computed at 49.7 percent in 2020. This means that there is one person aged 60 years and over for every two children under 15 years old. In 2015, the aging index was 10.3 points lower at 39.4. (Table 2 and Figure 7)
SGD. JEANETTE M. MARZAN
Chief Statistical Specialist